16 |
DRIVING IT UP
STAMFORD TYRES CORPORATION LIMITED
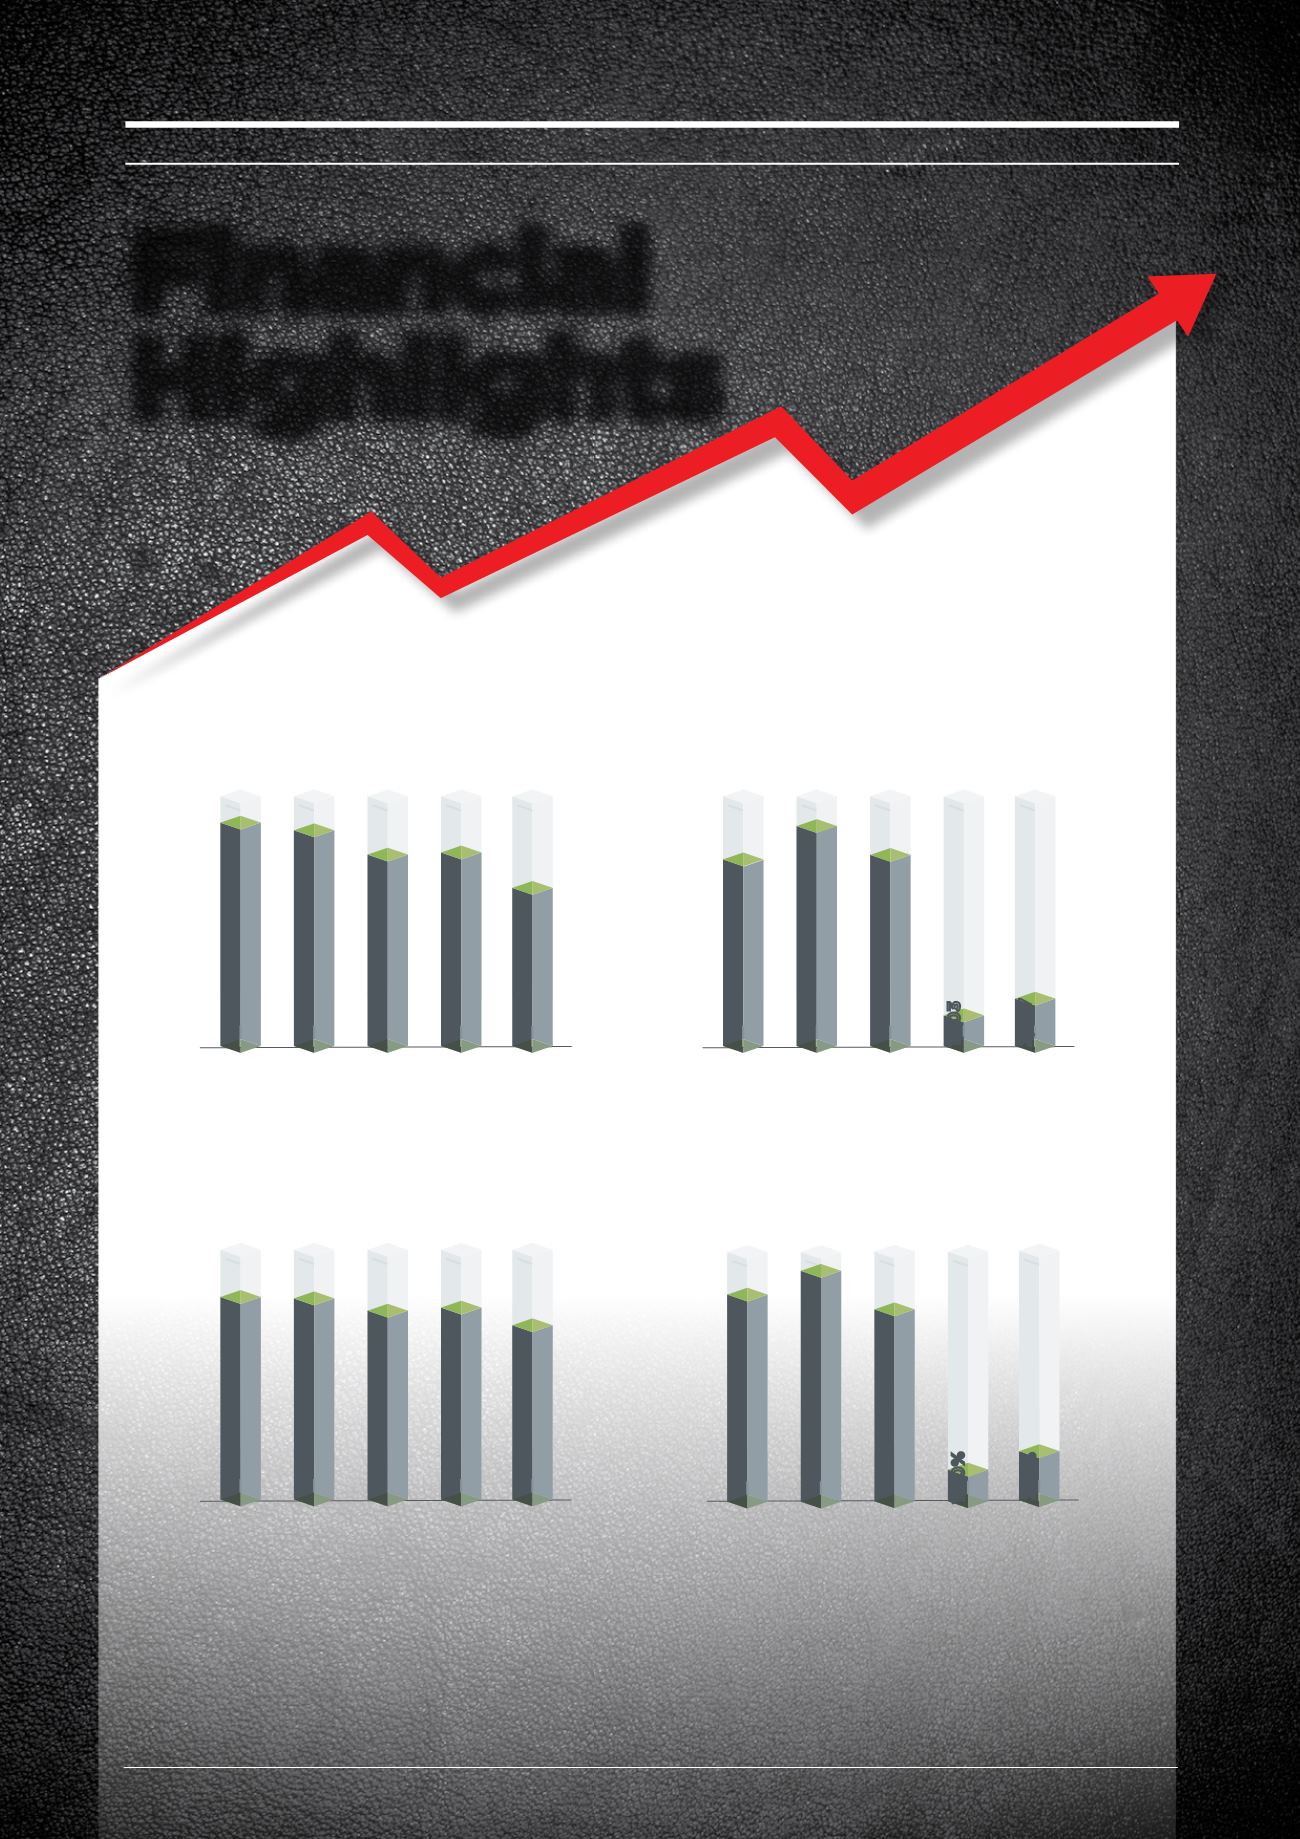
Financial
Highlights
Group Turnover (S$’000)
Total Assets (S$’000)
Return On Shareholders’
Equity (%)
Profit After Tax (S$’000)
2012
2012
2012
2013
2013
2013
2014
2014
2014
2015
2015
2015
2016
2016
2016
307,142
8.88%
304,465
9.91%
11,558
9,757
286,460
8.25%
10,016
291,111
1.40%
1,703
2012 2013 2014 2015 2016
239,878
292,515
290,615
317,462
338,177
264,961
2.17%
2,587


